Seeing your Ad statistics
# Dashboard Widgets
From the control panel Dashboard, click the settings icon. You can click the "New Widget" button to add a new widget to your dashboard.
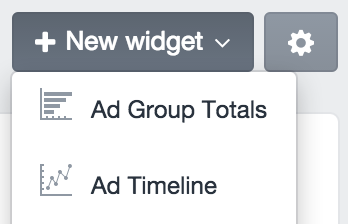
Two new widget types will be available to you:
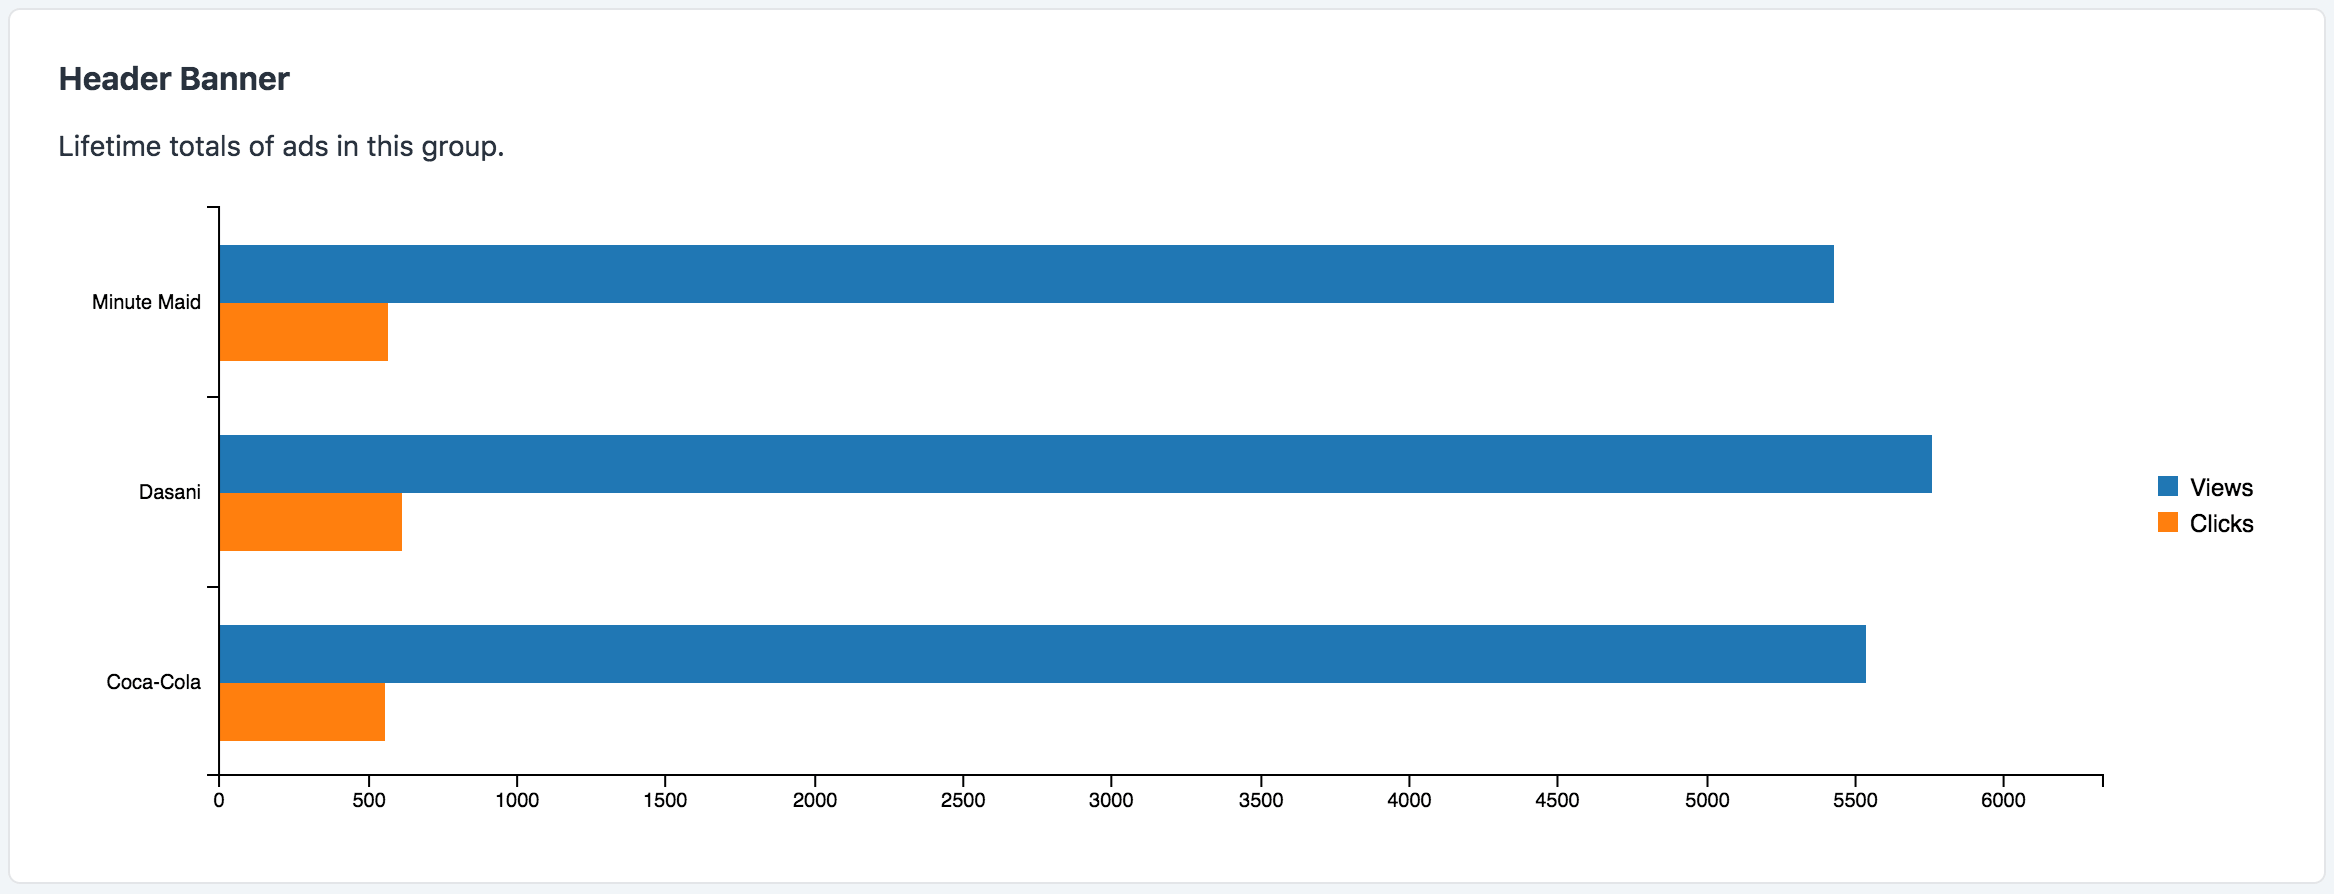
- Ad Group Totals - A bar chart showing the total views/clicks for each Ad in a specified group.
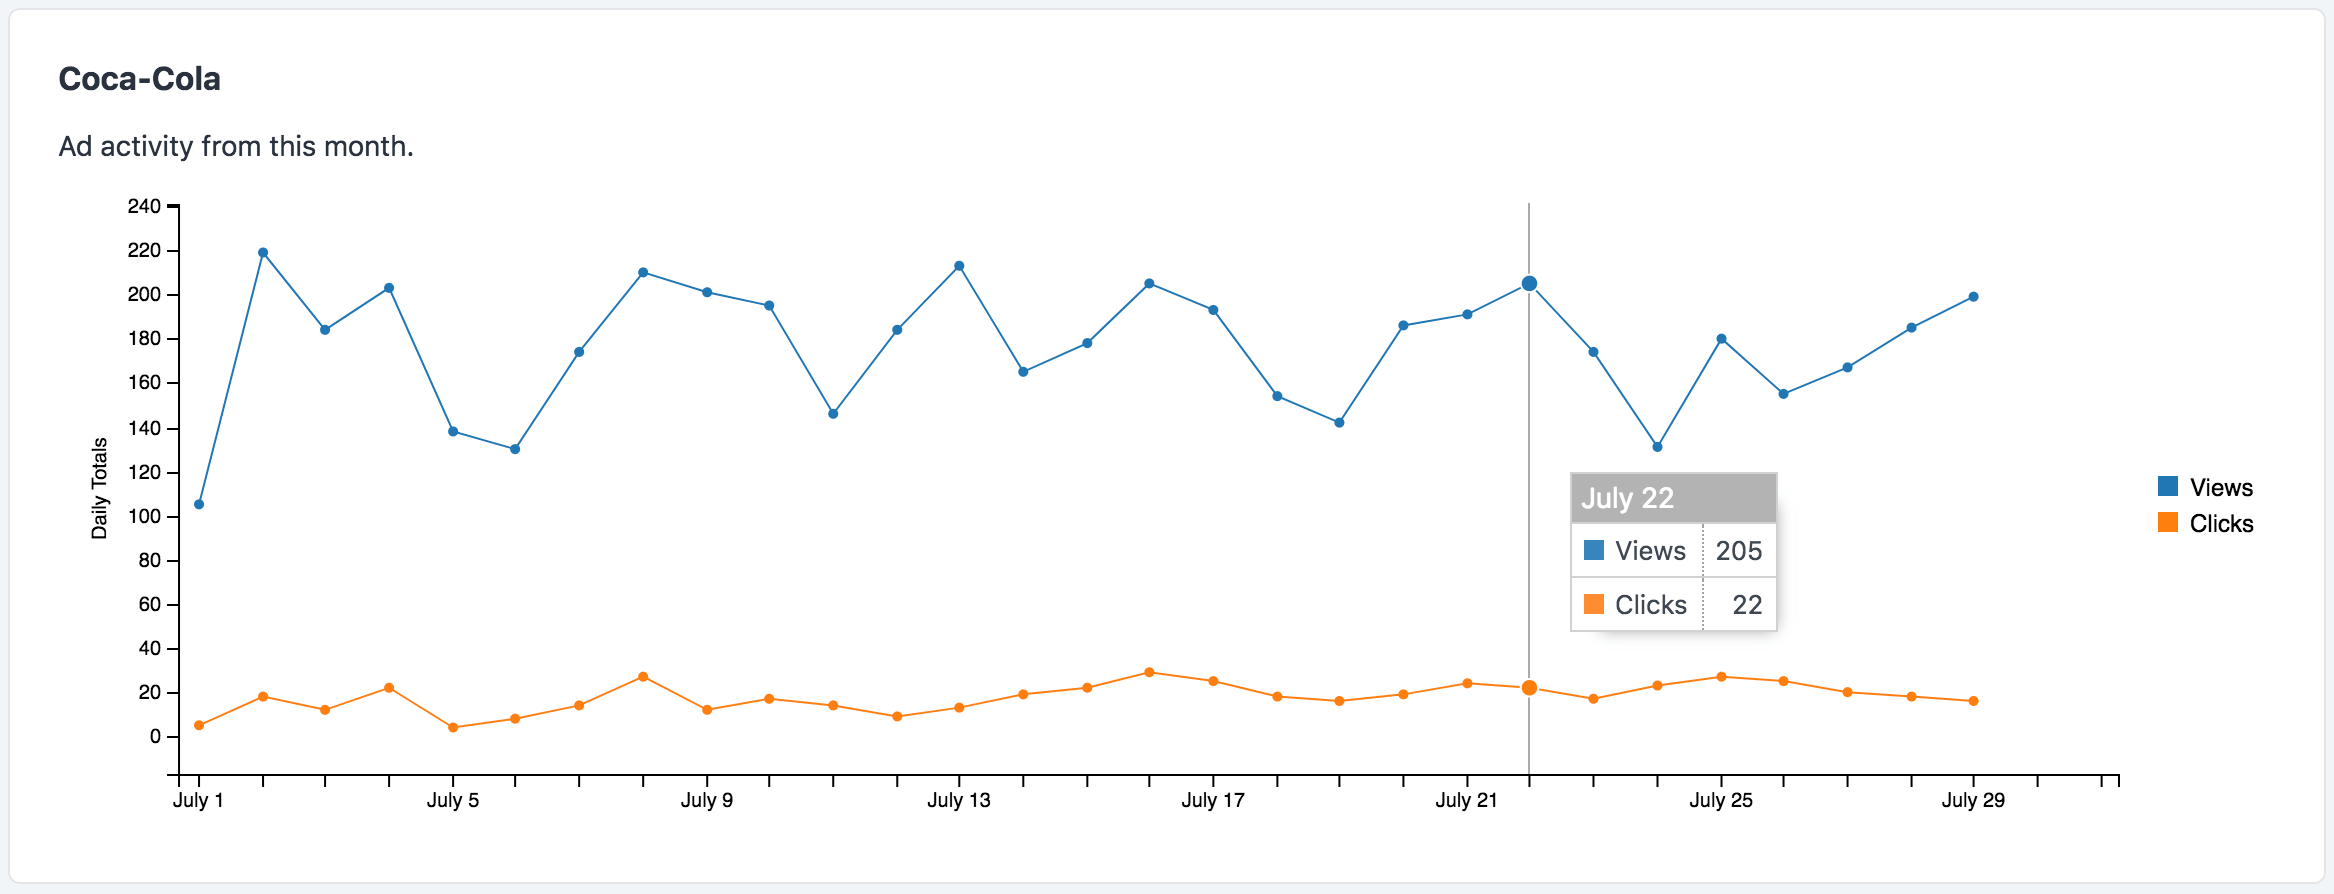
- Ad Timeline - A line chart showing the view/click trends of a single Ad over time.
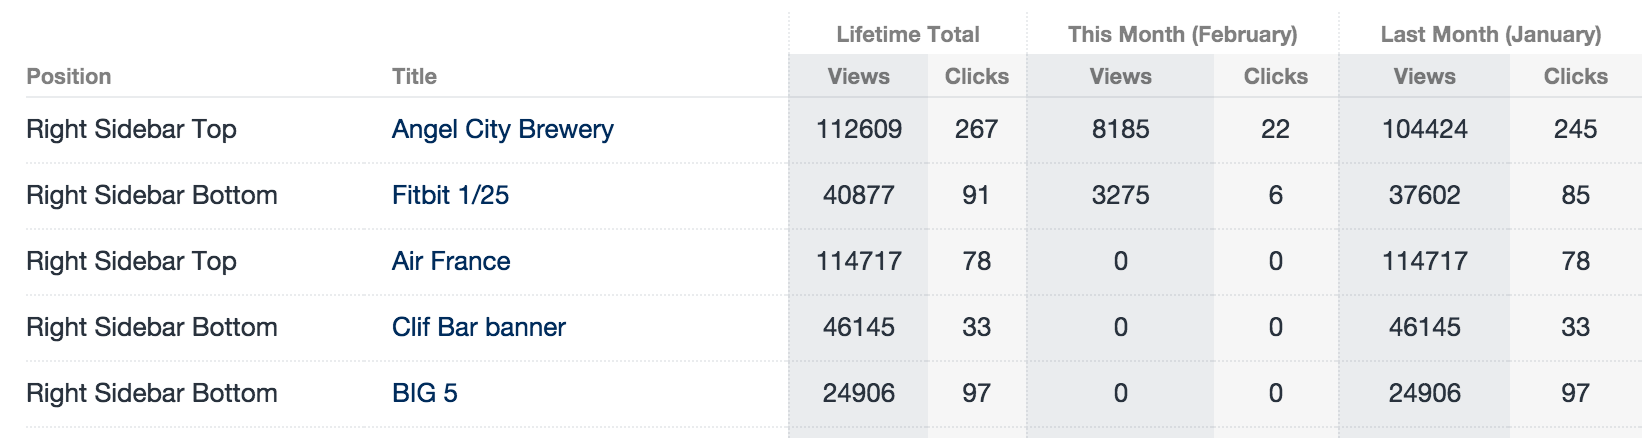
# Detailed Stats
You can also see a detailed chart by viewing the "Stats" page...